Attack graphs in cyber security
The frequency of cyber attacks and the possible damages they can cause, demand systematic and reliable approaches to address security issues. A highly valuable method that is preventing the occurrence of attacks, by exploiting vulnerabilities and detecting those attack scenarios that are most likely to happen, is “attack graphs”.
One of the main objectives of CYRENE is to enable organisations to enhance control and trust, with regards to their Supply Chains, by providing a holistic solution (WP3/WP4) that will support:
- a thorough assessment of vulnerabilities of cyber assets;
- a continuously forecast and evaluation of probabilities of cyber-attacks;
- management of relevant warnings related to potential upcoming attacks and vulnerabilities; and
- forecasting and propagation of cascading effects of attacks across supply chain services.
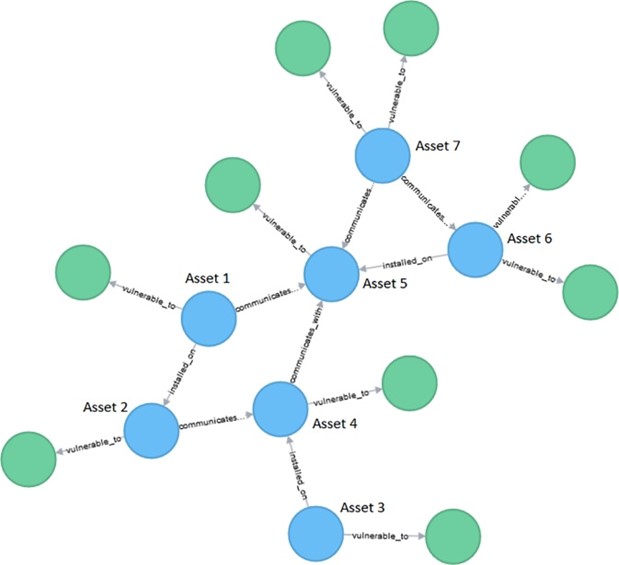
Attack graphs are significant in this area, as they represent the possible attack paths inside a network topology. They are represented as directed, acyclic graphs, that can be constructed by knowing the target network topology, including the communication rules, as well as the list of possible vulnerabilities. Before creating the graph, a reachability analysis and an attack template establishment are conducted. A reachability analysis provides a computation of the reachability conditions among network nodes, while the establishment of an attack template describes the elements of various attacks, the conditions for the elements of an attack and the relations among them.
Where can you use attack graphs?
The possibilities for usage are versatile. Besides vulnerability analysis and attack path prediction, an attack graph can be also helpful in selecting the nodes, whose security needs to be hardened and used in an uncertainty analysis. There is a variety of different methods that can be used for attack graph analysis. The selection of the most appropriate one depends on the goals intended to achieve. For instance, two commonly used probability-based models are Bayesian networks and Markov models. Bayesian networks represent a suitable manner to identify nodes that are at high risk of attacks, in order to reinforce them, where Markov models are frequently used for attack behavior prediction and detection of most likely attack paths. Additionally, there is a wide range of analysis techniques applicable for these models, that enable deriving different sets of conclusions.
The use of attack graphs with appropriate analysis methods can be of great value for network topology security properties investigation. Attack graph analysis methods are developing continuously, aiming to address the emerging issues and dynamic nature of attacks. Understanding the nature of attack graphs and applying an appropriate analysis method can be of great value for network security evaluation and possible attacks predictions.
If you would like to find out more about Bayesian networks see here and about Markov models see here.
Are you familiar with attack graphs as a user or as a developer? What do you think about their effectiveness? CYRENE is organizing its first Hackathon and graph analysis is part of the technologies and methodologies to be explored. Interested? Sign up here!
Reach out to us and share your views either by using our contact form or by following our social media accounts in Twitter and LinkedIn.
Don’t forget to subscribe to our Newsletter for regular updates!
This blog is signed by: The UNSPMF team
KEY FACTS
Project Coordinator: Sofoklis Efremidis
Institution: Maggioli SPA
Email: info{at}cyrene.eu
Start: 1-10-2020
Duration: 36 months
Participating organisations: 14
Number of countries: 10
FUNDING
 This project has received funding from the European Union’s Horizon 2020 Research and Innovation program under grant agreement No 952690. The website reflects only the view of the author(s) and the Commission is not responsible for any use that may be made of the information it contains.