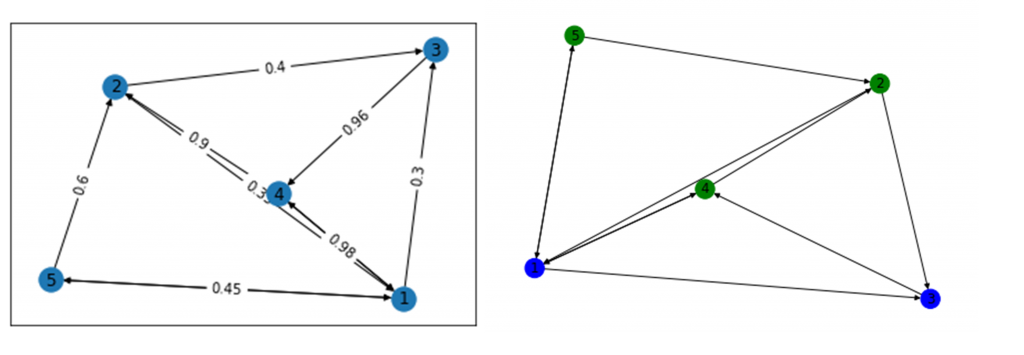
The supply chain has a wide range of assets. It contains hardware, software, business processes and humans. They have value to the Supply Chain Service Provider (SCSP) and are threatened by threat actors.
Since the defence budget in the field of cyber security is limited, it is crucial to have an insight into the priority of the assets in order to spend the hardening budget in an effective manner. By applying graph theory to this domain, SCSPs will be able to analyse their assets from criticality points of view in order to identify the most critical assets and prioritise securing them.
Criticality in cyber security has been treated in two different ways. On one hand, asset criticality is defined in the context of risk assessment in which the relative “Failure” risk for an asset is considered. In order to calculate the criticality in this way, two parameters are needed: 1- the probability of failure related to the asset and 2- the consequences (monetary) of such a failure. By multiplying these two factors the final value for asset criticality will be calculated. Asset criticality in the context of risk assessment has a close relationship with the concept of reliability.
On the other hand, the criticality of an asset can be assumed and interpreted as the importance of that asset. According to this attitude, relationships and dependencies among assets play a major role in identifying the importance of the assets. This is exactly where graph theory comes to play. By modelling the assets and their dependencies using graph theory, concepts like centrality may help to indicate which nodes and edges are important. In doing so, first, a graph is constructed based on the specific layout of the SCP (asset-driven, business-driven or sector driven). Then a number of graph-based metrics which are classified as “Centrality” metrics can be used to analyse assets in terms of criticality. These metrics can be employed to identify the most important nodes (assets) within a graph. The concept of centrality has different flavours and each of them looks at the importance of a node (asset) in a different and unique way.
The most relevant algorithms for calculating the importance of the nodes are as follows:
- Degree Centrality is the most common metric and is defined as the number of direct connections to a node (In/Out).
- Closeness Centrality is anoththattric which investigates how close a node is to all other nodes in a graph. In doing so, the closeness algorithm uses the Geodesic distance concept. Geodesic distance is defined as the number of connections between any two nodes on the shortest path between them.
- Betweenness Centrality as flavorrd flavour of the centrality metrics measures the importance of a node based on the number of times by which that node falls on the shortest path between all pairs of nodes in a graph.
- Eigen Vector Centrality calculates the importance of a node by considering its influence on the graph. A node with a higher number of connections coming from other nodes in a graph has a higher Eigen Vector Centrality value than the node with a lower number of connections. One of the applications of Eigen Vector Centrality is in the Page Rank algorithm used by Google.
Stockholm University as a member of the CYRENE consortium employed centrality mettoer to calculate the asset criticality in the CYRENE project. In the next part, we will show you how these metrics were used in analysing asset criticality within the CYRENE project.
So what do you think? Stay Tuned for the next part of the SU blog post series on asset criticality.
Reach out to us and share your views either by using our contact form or by following our social media accounts on Twitter and LinkedIn.
Don’t forget to subscribe to our Newsletter for regular updates!
This blog is signed by: the SU team
KEY FACTS
Project Coordinator: Sofoklis Efremidis
Institution: Maggioli SPA
Email: info{at}cyrene.eu
Start: 1-10-2020
Duration: 36 months
Participating organisations: 14
Number of countries: 10
FUNDING
 This project has received funding from the European Union’s Horizon 2020 Research and Innovation program under grant agreement No 952690. The website reflects only the view of the author(s) and the Commission is not responsible for any use that may be made of the information it contains.


